OKRs · The OKR Manual, No. 12
OKRs for Marketing
Marketing can always prove it was busy. Key Results that show what changed in how the company is found and chosen, including brand.

Marketing can always prove it was busy. There is a calendar of campaigns, a content schedule, a launch date for the new site. That is why marketing OKRs so often turn into a project plan with percentages on it.
The harder and more useful question is what changes in the business if all of that works. This article is about writing Key Results that answer it.
What marketing is really trying to change
Running the channels, publishing, sending the newsletter and answering the inbound are the business as usual. They need owners and a few health metrics, and they are not OKR material.
The change is how the company is found and chosen. More of the right people arriving. Fewer wasted leads. A website that does the work of a sales rep. A name that comes up unprompted when a buyer starts a search. Those take sustained effort across a quarter or more, and they are where an Objective belongs.
Outcome versus output, marketing edition
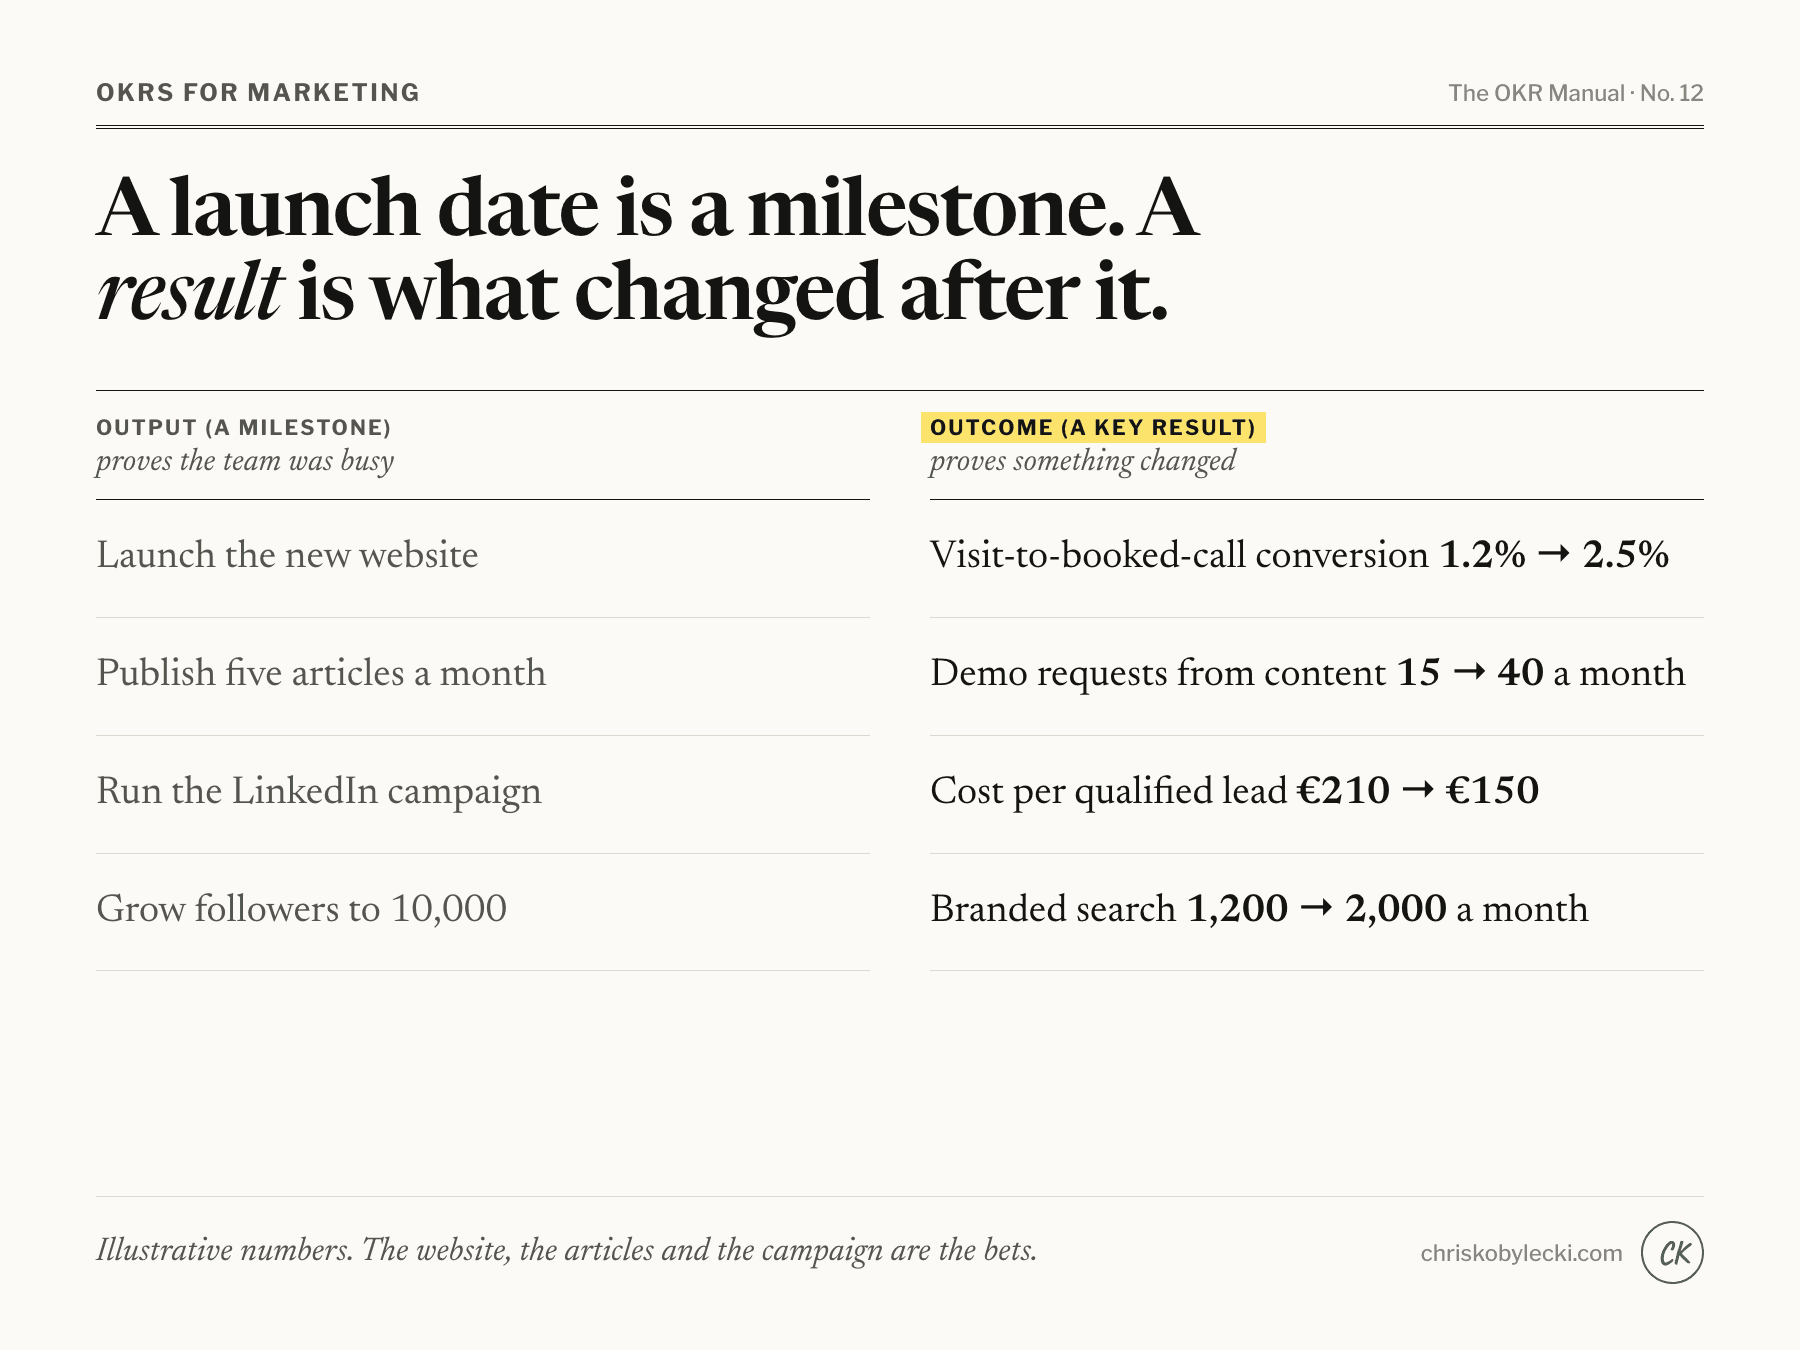
Marketing outputs are visible and satisfying, which is the problem. A launch date is a milestone, and a milestone is not a result. Rewrite each with the question from Article 5: what is different for the business if this works?
| Output as a KR | Outcome as a KR (illustrative numbers) |
|---|---|
| Launch the new website | Raise visit-to-booked-call conversion from 1.2% → 2.5% |
| Publish five articles a month | Raise demo requests that start from content from 15 → 40 a month |
| Run the LinkedIn campaign | Cut cost per qualified lead from €210 → €150 |
| Grow followers to 10,000 | Raise branded search from 1,200 → 2,000 a month |
| Redesign the newsletter | Raise newsletter readers who visit a pricing page from 3% → 6% |
The website, the articles and the campaign remain. They are the initiatives, the bets on how to move the number. If the site launches and conversion does not move, that is a finding, and a more valuable one than a green milestone.
Three seats, three sets of numbers
The numbers below are illustrative. Each seat owns different levers, and the three sit on top of one company outcome.
Head of marketing
Objective: Become the obvious choice in our category
- Share of inbound leads who name us unprompted from 20% → 35%
- Branded search from 1,200 → 2,000 a month
- Share of pipeline sourced by marketing from 25% → 40%
Growth or demand generation lead
Objective: Make the website do a sales rep's job
- Visit-to-booked-call conversion from 1.2% → 2.5%
- Cost per qualified lead from €210 → €150
Content or brand lead
Objective: Turn content into pipeline
- Demo requests that start from content from 15 → 40 a month
- Share of top-ten articles with a clear next step from 20% → 80%
The head's numbers describe the company's standing. The growth lead's numbers describe the funnel. The content lead's numbers describe whether the writing leads anywhere. The three feed each other, and each can say how.
Measuring what resists measurement
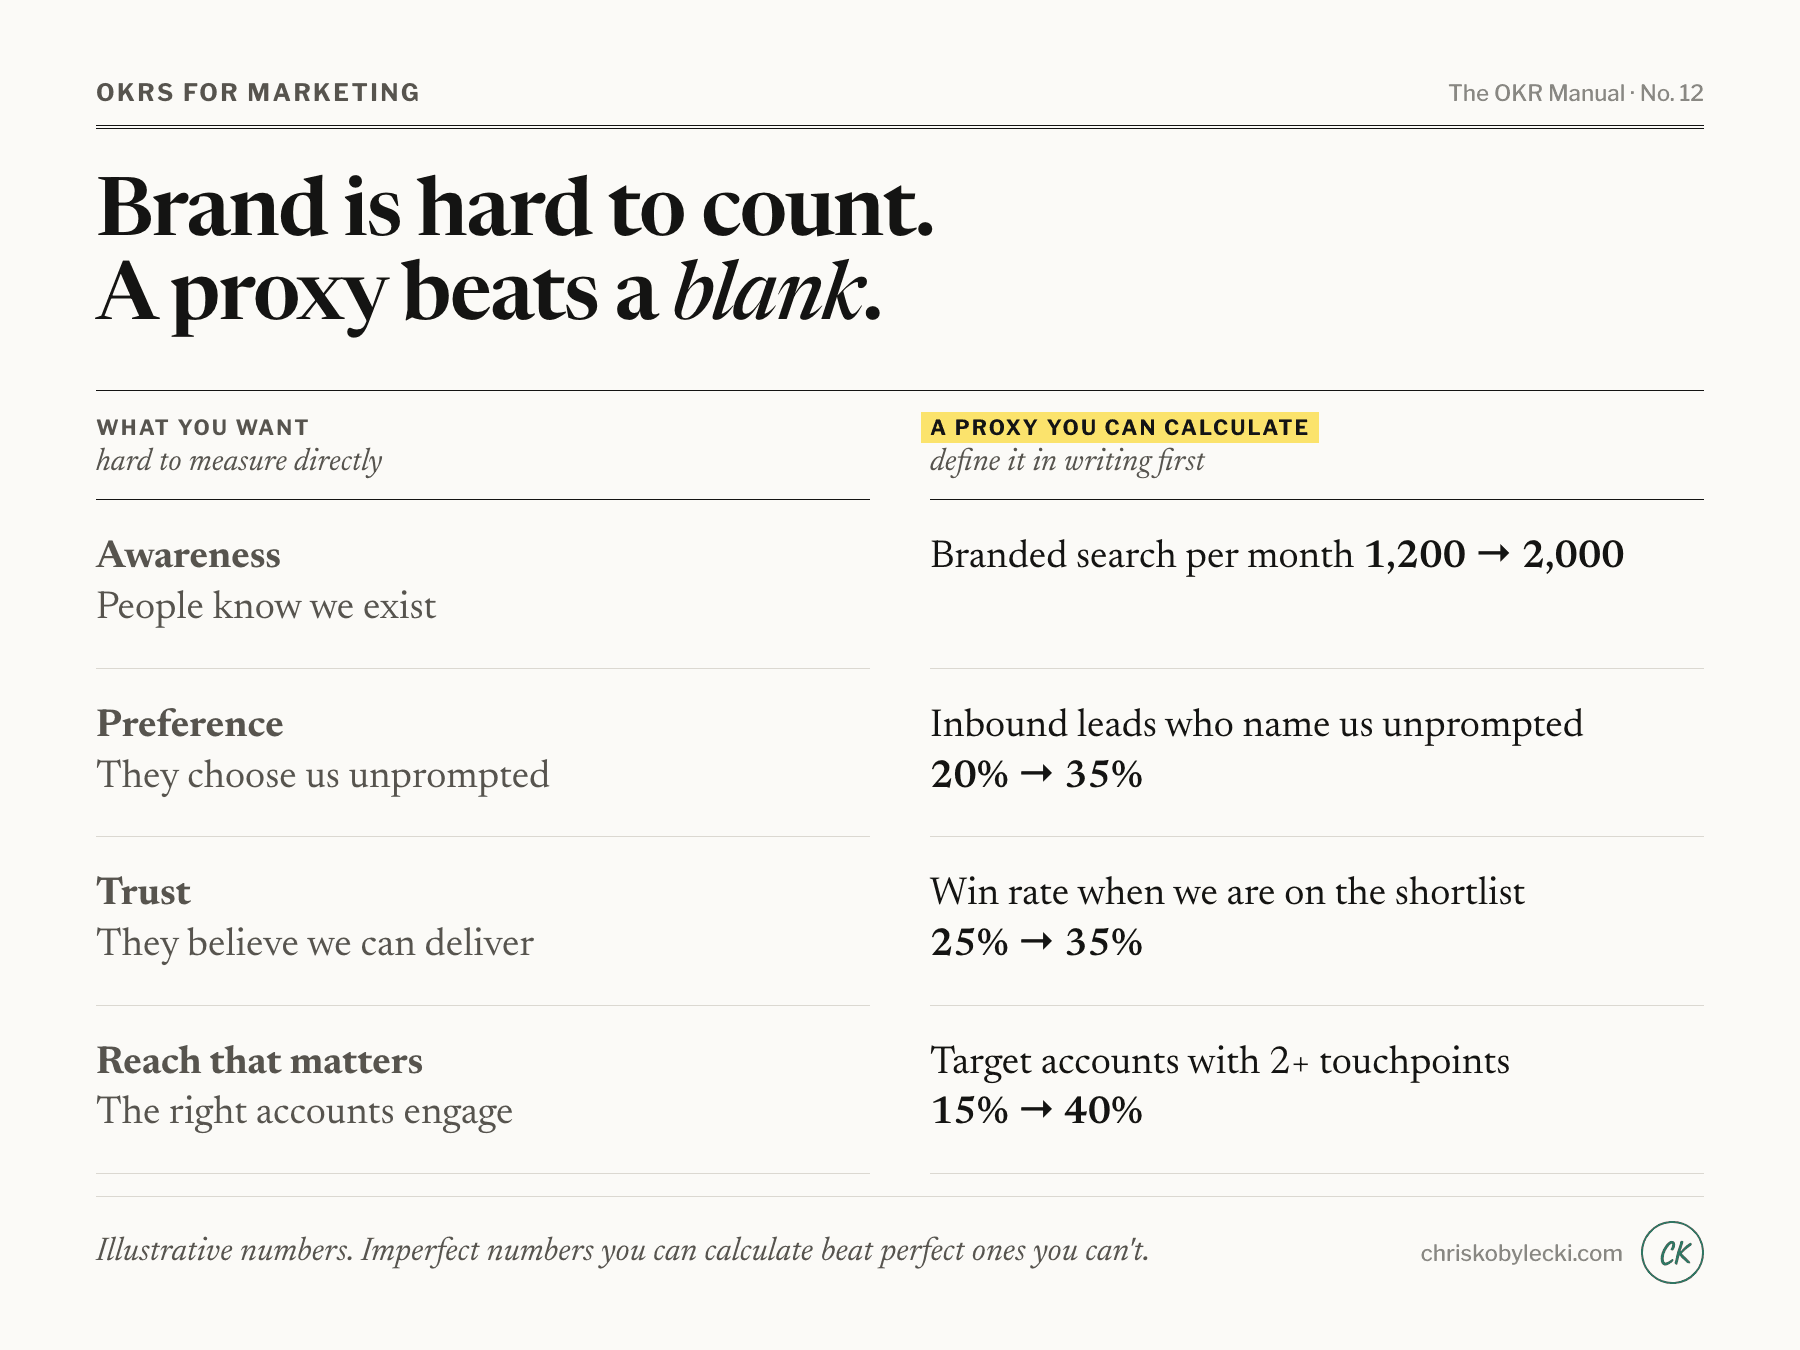
Brand is the awkward one. Marketing teams avoid it in OKRs because it is hard to count, and then the most strategic work goes unmeasured.
The answer is proxies you can calculate, with a definition written down. Awareness shows up in branded search volume. Preference shows up in how many inbound leads name you without prompting, which you can capture with one question on the contact form. Trust shows up in win rate when you are on the shortlist. None of these is perfect. Each is better than a blank.
The same goes for attribution. Decide before the quarter starts what "sourced" means and what "influenced" means, who applies the label, and where it is recorded. A pipeline number that two people calculate differently will drift and cost a check-in to argue about (Article 2, reason 7).
Where it goes wrong
Vanity metrics. Followers, impressions and page views rise easily and prove little. Use them to diagnose, not to set targets.
Campaign lists as Key Results. "Run the spring campaign, the webinar series and the partner promotion" is a to-do list. It is three initiatives waiting for a number.
The "publish five articles" trap. Output you control completely is a task. If the Key Result can be finished by working harder, it is not measuring a result.
Leading and lagging mix-ups. Pipeline lags content by months. A quarter-long KR on revenue from this quarter's articles will almost always miss. Use a leading indicator (demo requests, engaged accounts) as the Key Result and watch the lagging number on the dashboard.
No agreement with sales. If marketing and sales define a qualified lead differently, a good marketing number can coexist with an angry sales team. Settle the definition together, in writing, before either writes a Key Result.
How it ladders up
Connect each marketing Key Result to something the company has already chosen. If the company objective is moving up-market, marketing's Key Results are about the quality and size of the accounts it brings in. If it is lowering the cost of growth, they are about cost per qualified lead and conversion. Say the link out loud during the setting session. If the sentence "this moves that because…" doesn't finish, the number may be local.
Where I would start
Pick the one funnel stage that worries the head of marketing most. Write one Objective and two or three Key Results around it. Agree the definitions with sales. Run the weekly check-in on one question: which initiative would we stop if the number does not move by the halfway mark?
What it surfaces
OKRs surface problems; they don't solve them. In marketing, the problem is often that nobody could say which of the many activities was working, because nobody had written down what working meant. That is uncomfortable, and it makes the next quarter's budget conversation much easier.
Next: product and engineering.