OKRs · The OKR Manual, No. 11
OKRs for Sales
Sales measures everything, which makes it easy to pick the wrong numbers. Quota is the job. The Key Result is the change in how the team sells.

Sales is the function with the most numbers and the least clarity about which of them are Key Results. Everything is measured: calls, meetings, pipeline, bookings, quota. So when OKR time comes, the temptation is to pick a few from the dashboard and call them done.
That produces a tidy page and no change. This article is about separating the number you are paid to hit from the change you are trying to make.
What sales is really trying to change
Quota is the business as usual. The team is expected to hit it every quarter, and the commission plan already makes that clear. If quota goes in the OKRs, the OKRs add a second copy of a target everyone already has.
The change is something else: how the team sells. A process that works without the founder in the room. New reps who become productive in months instead of a year. A higher win rate against the competitor you keep losing to. A forecast the CFO can trust. These are the goals that take a quarter or more of deliberate effort, which is exactly what OKRs are for.
Outcome versus output, sales edition
Activity numbers are easy to count, so they get promoted into Key Results. Rewrite them with the question from Article 5: what changes for the business if this works?
| Activity as a KR | Outcome as a KR (illustrative numbers) |
|---|---|
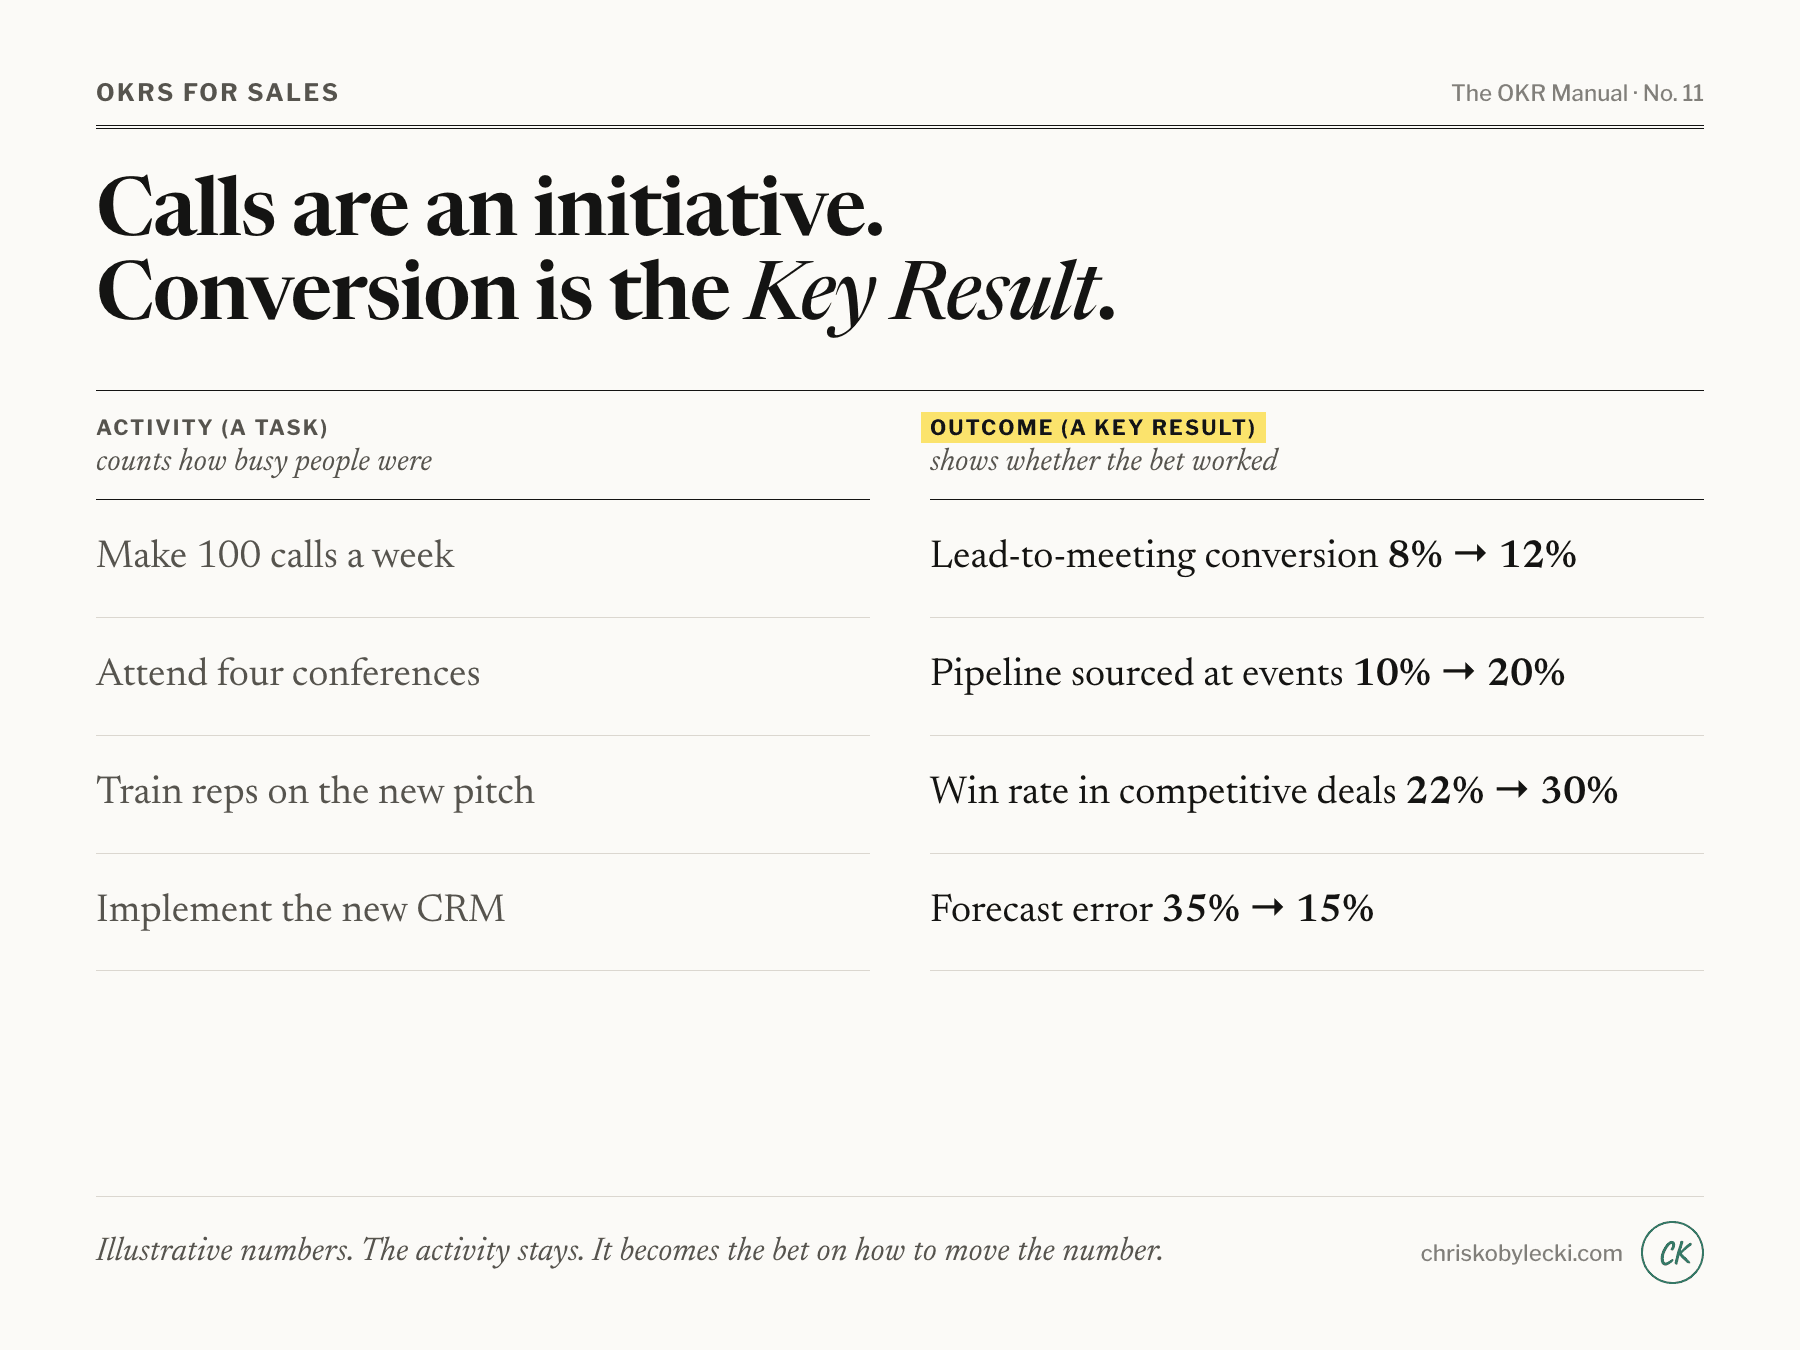
| Make 100 calls a week | Raise lead-to-meeting conversion from 8% → 12% |
| Attend four conferences | Raise pipeline sourced at events from 10% → 20% |
| Train reps on the new pitch | Raise win rate in competitive deals from 22% → 30% |
| Implement the new CRM | Narrow forecast error from 35% → 15% |
| Book 20 meetings | Raise meeting-to-opportunity conversion from 40% → 55% |
The calls, conferences and training do not go away. They are the initiatives, the bets on how to move the number. Counting them tells you whether people were busy. Counting the conversion tells you whether the bet worked.
Three levels, one thread
Sales is a good function to show how OKRs look at different altitudes, because the same story runs from the head of sales down to the individual rep. The numbers below are illustrative.
Head of sales
Objective: Build a sales process that works without heroics
- Win rate on qualified opportunities from 22% → 30%
- Average sales cycle from 90 days → 65 days
- Share of new pipeline that does not come from the founders' network from 20% → 50%
Sales manager
Objective: Make new reps productive fast
- Days from start date to first closed deal from 120 → 75
- New reps reaching half of quota by month four from 30% → 60%
- Share of new reps who can run a discovery call unassisted by week six from 40% → 80%
Account executive or SDR
Objective: Fill my pipeline with deals worth winning
- Qualified opportunities created per month from 6 → 10
- Discovery-to-proposal conversion from 35% → 50%
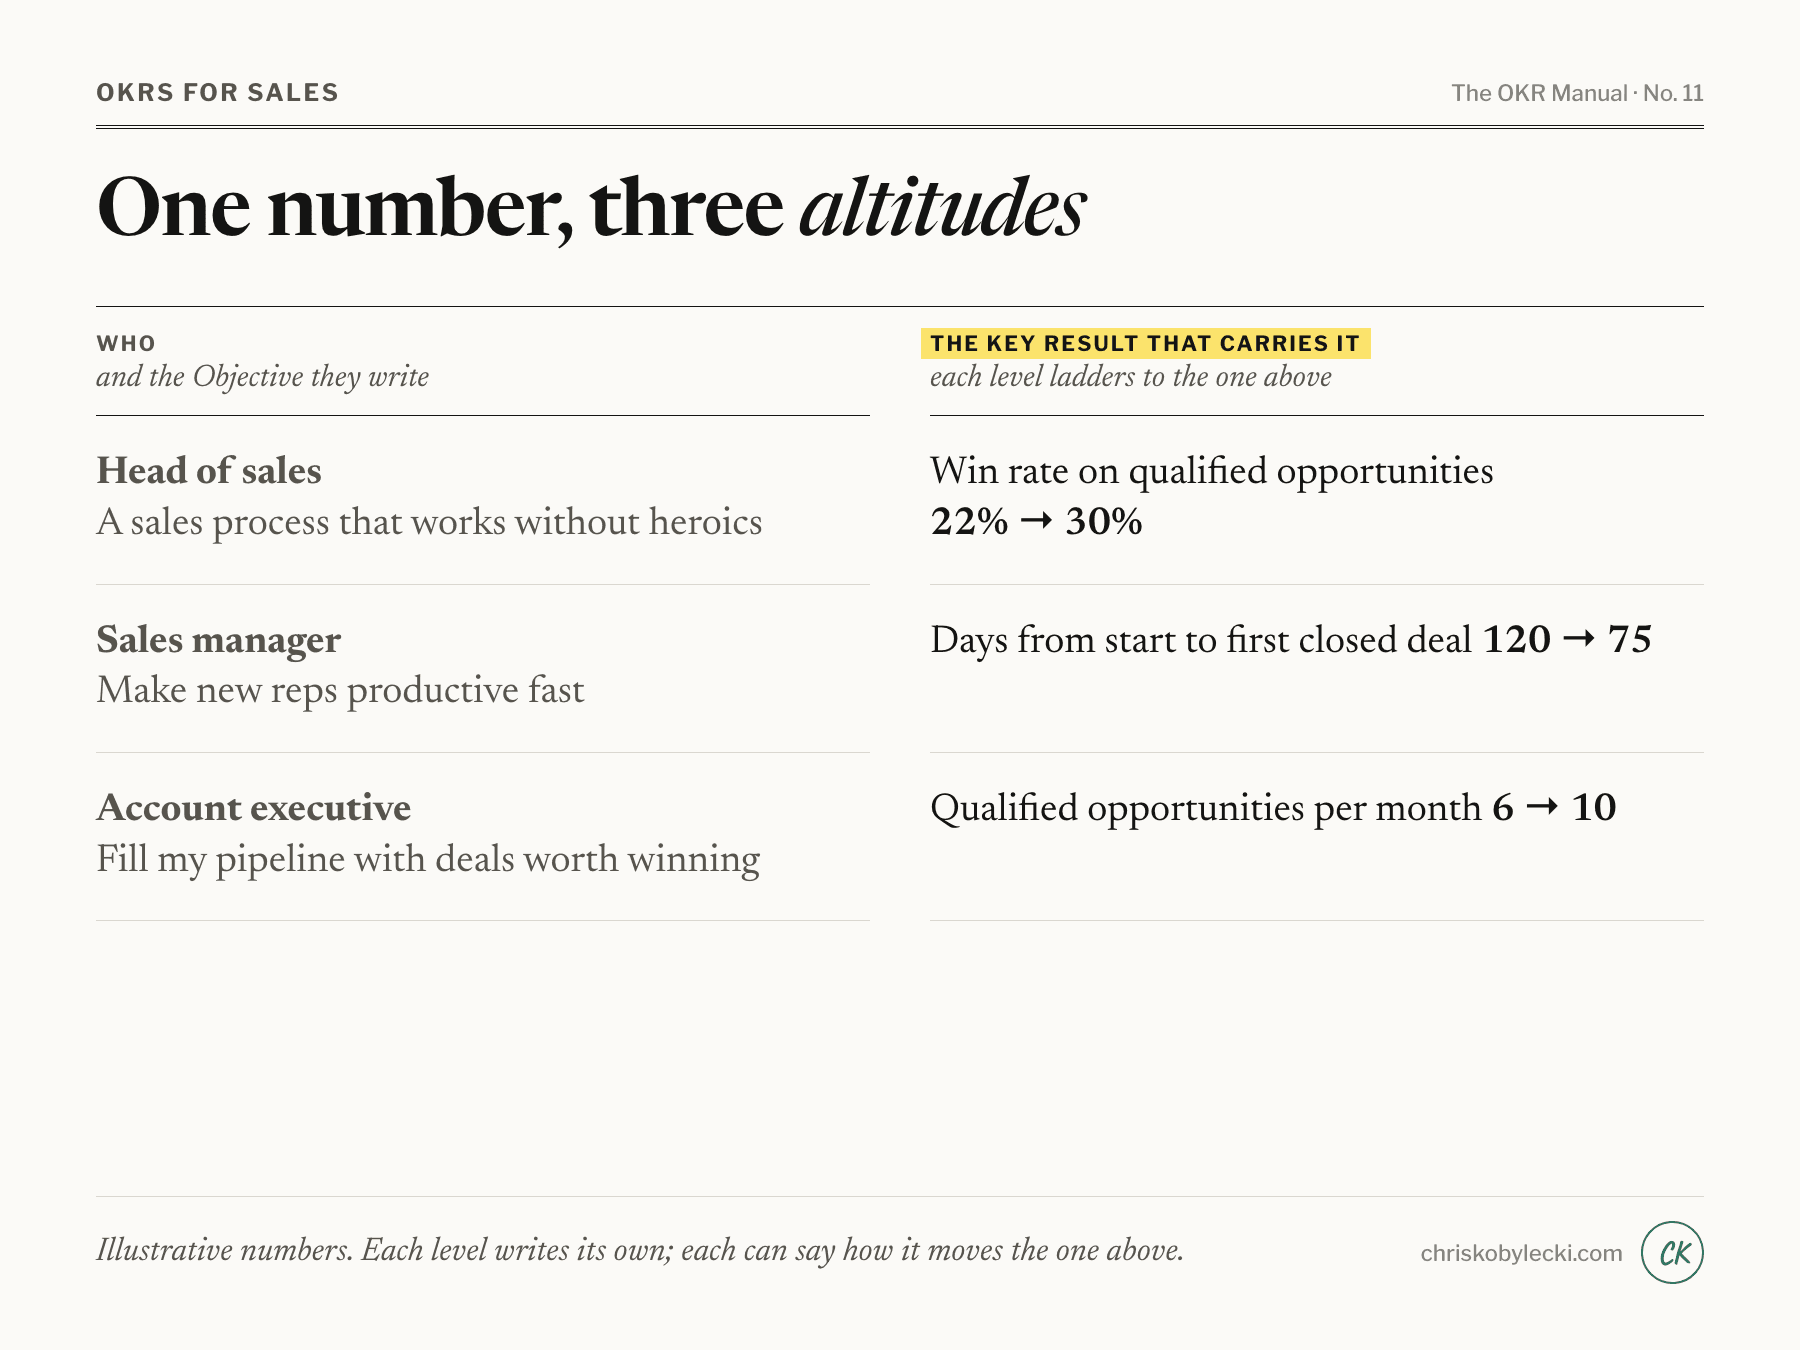
Read them top to bottom and one story appears. The head of sales wants a higher win rate. The manager's ramp work puts better-prepared reps into deals. The rep's focus on qualified opportunities means fewer deals that should never have been pursued. Each level writes its own numbers, and each can explain how its numbers move the one above.
Individual OKRs are optional. Many teams do better with team-level OKRs for the first two cycles and add individual ones only when the team is comfortable with the rhythm.
Where it goes wrong
Activity metrics as KRs. Calls, emails and demos are inputs. Use them as a diagnostic when a conversion number is stuck, not as the goal.
Sandbagging the quota into the OKR. If a rep's quota is 100 and the Key Result says 70, the rep will hit 70, and the quarter's stretch disappears. Keep quota in the comp plan and the OKR about the change.
Confusing quota with change. If the Key Result would be met by doing the job as usual, it belongs on the dashboard.
A comp plan that fights the OKR. This is the one that quietly kills sales OKRs. If the commission plan pays for volume and the OKR asks for fit and quality, the commission plan wins every time. Before the quarter starts, read the two side by side. If they pull in opposite directions, fix that first or accept that the OKR is decoration.
Conversion numbers nobody can calculate. What is a "qualified" opportunity? Who decides? Where does the stage change get recorded? If three reps and a manager give four answers, the Key Result will drift (Article 2, reason 7). Write the definitions down before the quarter starts.
How it ladders up
A department OKR should connect to a company one. If the company objective is profitability, sales may own the margin on new deals and the share of pipeline from the target segment. If the company objective is recurring revenue, sales may own the share of new contracts signed on a subscription. Say the connection out loud in the setting session: "this Key Result moves that company Key Result because…" If nobody can finish the sentence, the number is probably a local one and may be a KPI.
Where I would start
Pick one outcome that the head of sales would lose sleep over: win rate against a particular competitor, ramp time, forecast accuracy. Write one Objective and three Key Results around it. Read the comp plan next to it. Run the weekly check-in on one question: what is stopping this number from moving?
What it surfaces
OKRs surface problems; they don't solve them. In sales, the problem is often that the team could not tell you what a qualified opportunity is, or that the comp plan rewarded the opposite of what the strategy needed. Neither is comfortable. Both are cheaper to find in a quarter than in a year.
Next: marketing.